mpl_preferences
- pyhelpers.settings.mpl_preferences(reset=False, backend=None, font_name='Times New Roman', font_size=13, legend_spacing=0.7, fig_style=None)
Alter some Matplotlib parameters.
- Parameters
backend (str or None) – specify the backend used for rendering and GUI integration, defaults to
Nonefont_name (None or str) – name of a font to be used, defaults to
'Times New Roman'font_size (int or float) – font size, defaults to
13legend_spacing (float or int) – spacing between labels in plot legend, defaults to
0.7fig_style (str or None) – style of the figure, defaults to
Nonereset (bool) – whether to reset to default settings, defaults to
False
Examples:
>>> import numpy as np
>>> import matplotlib.pyplot as plt

>>> np.random.seed(0)

>>> random_array = np.random.rand(1000, 2)
>>> random_array
array([[0.5488135 , 0.71518937],
       [0.60276338, 0.54488318],
       [0.4236548 , 0.64589411],
       ...,
       [0.41443887, 0.79128155],
       [0.72119811, 0.48010781],
       [0.64386404, 0.50177313]])

>>> def example_plot(arr):
...     fig = plt.figure(figsize=(6, 6))
...     ax = fig.add_subplot(aspect='equal', adjustable='box')
...
...     ax.scatter(arr[:500, 0], arr[:500, 1], label='Group0')
...     ax.scatter(arr[500:, 0], arr[500:, 1], label='Group1')
...     ax.legend(loc='best')
...
...     plt.tight_layout()
...
...     plt.show()

>>> example_plot(random_array)
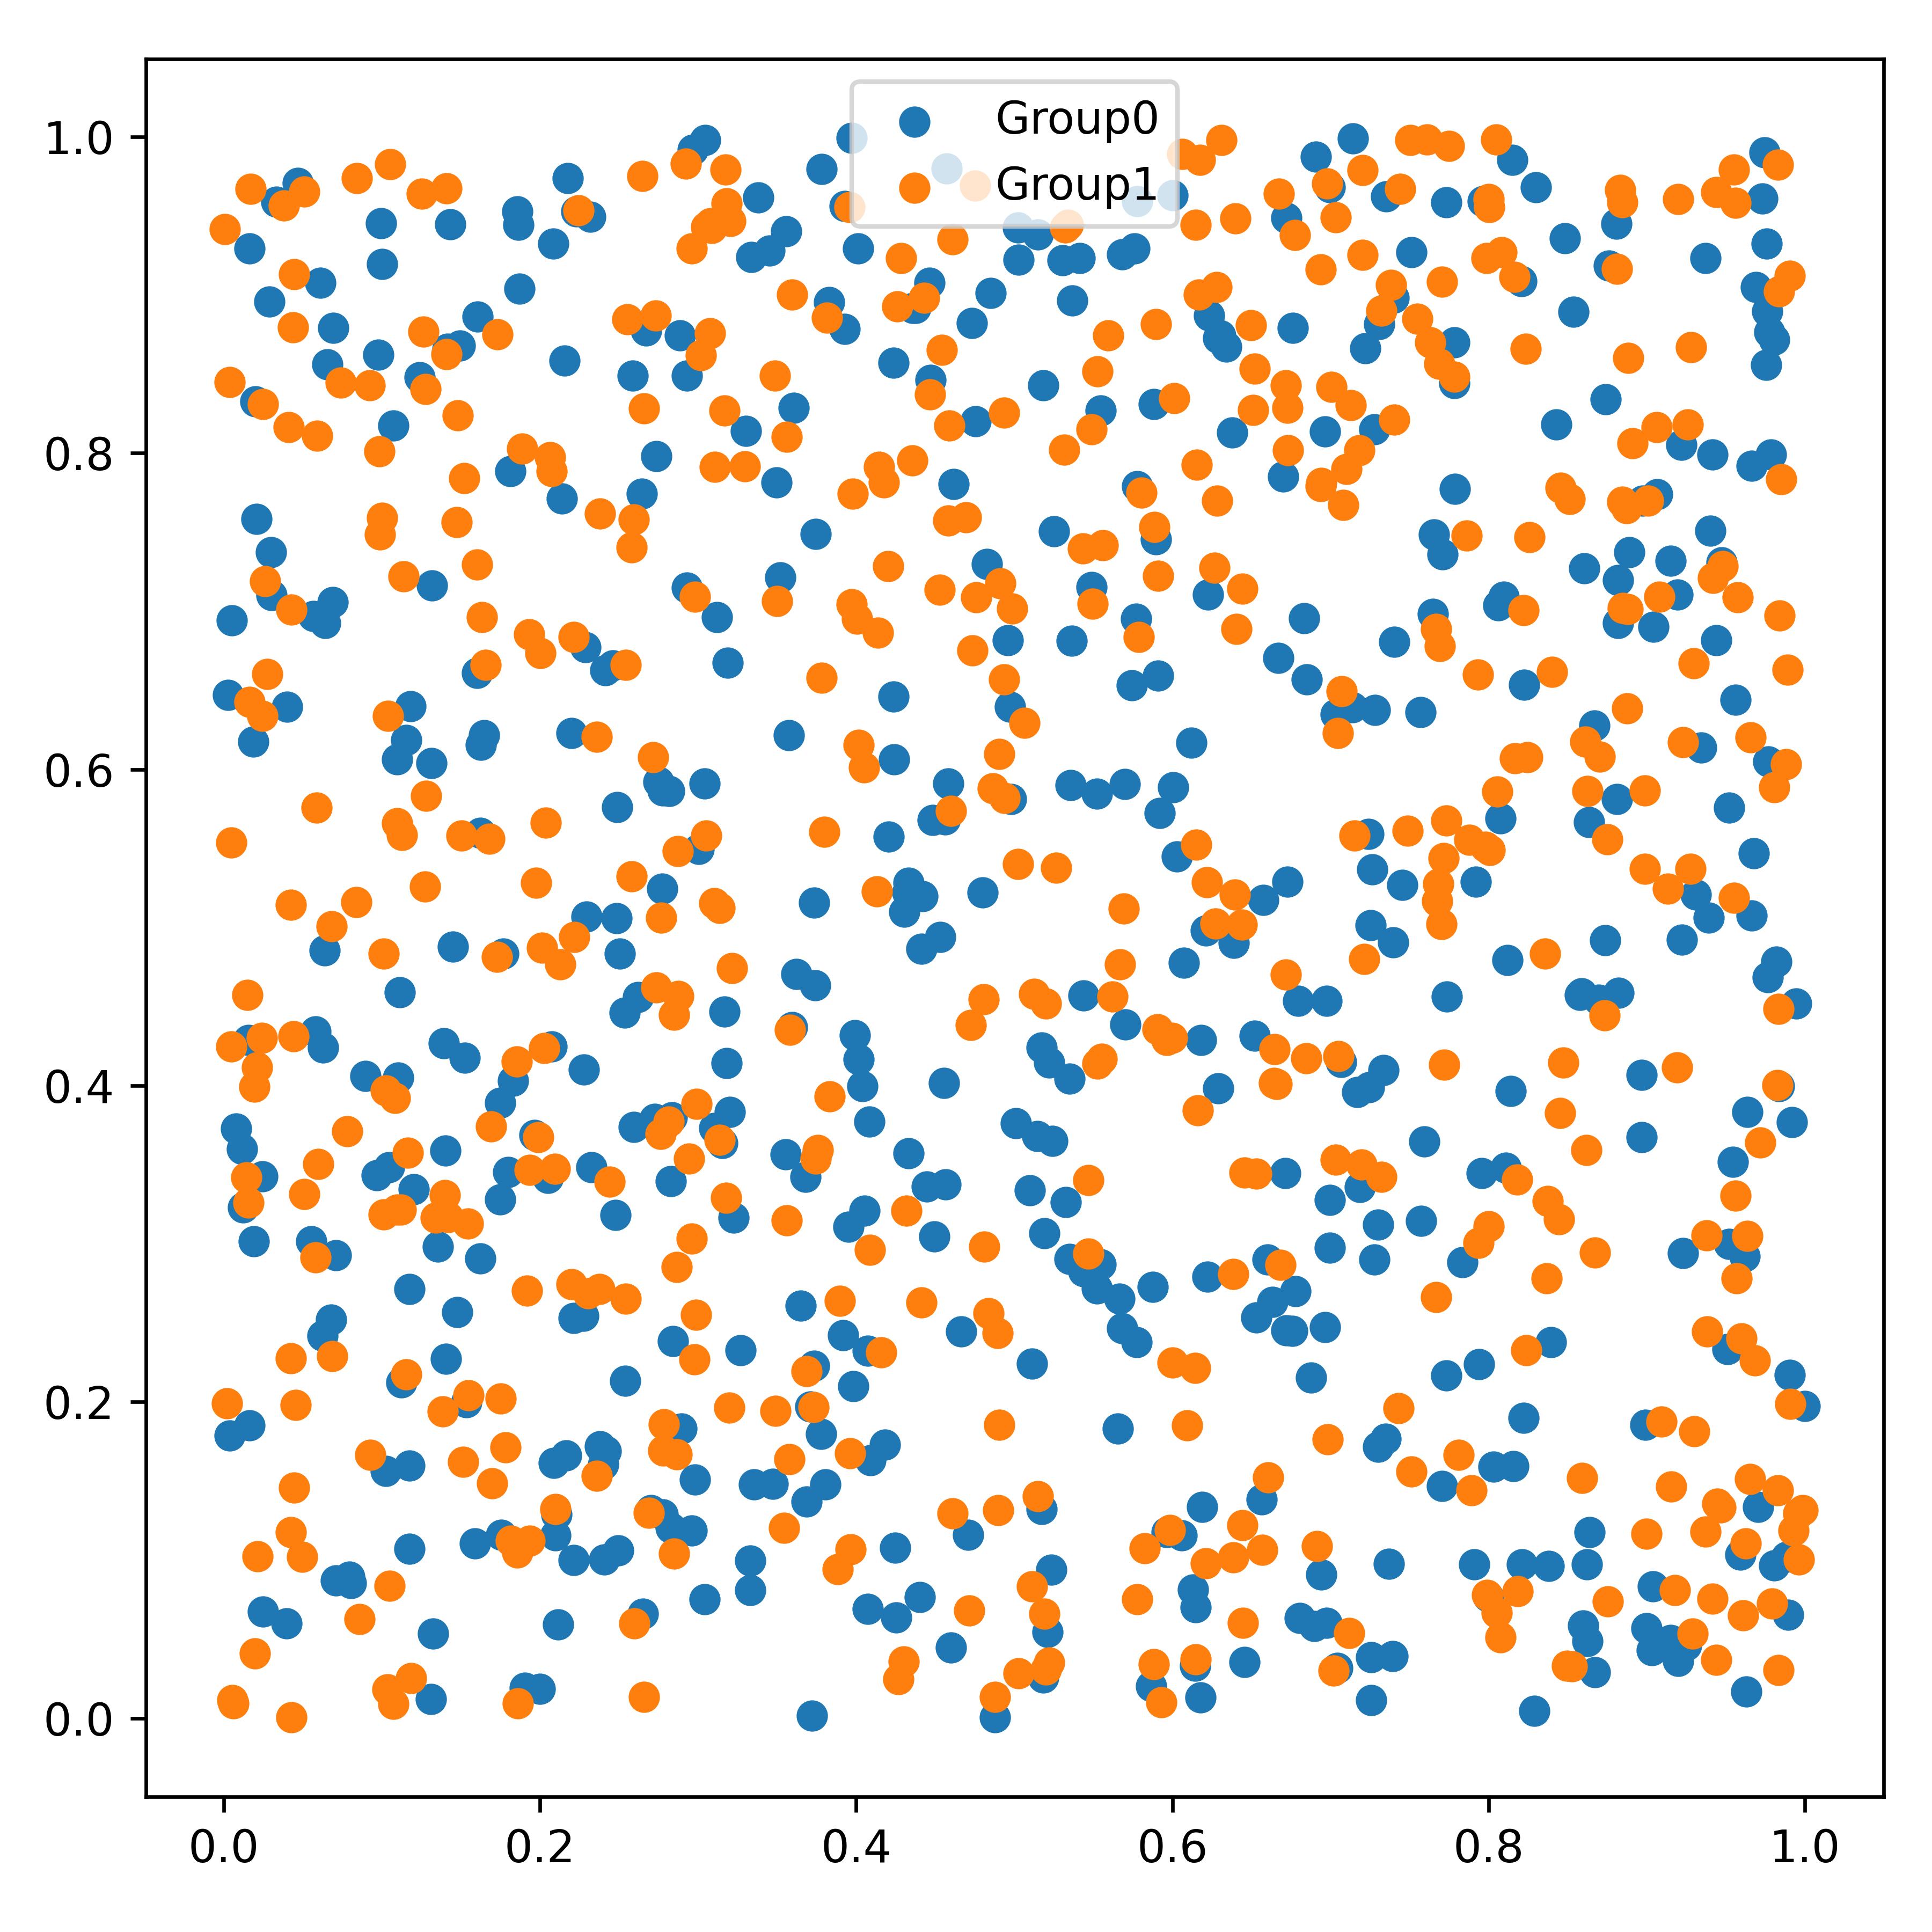
Fig. 1 An example figure, before applying the function
mpl_preferences().>>> from pyhelpers.settings import mpl_preferences >>> mpl_preferences(fig_style='ggplot') >>> example_plot(random_array)
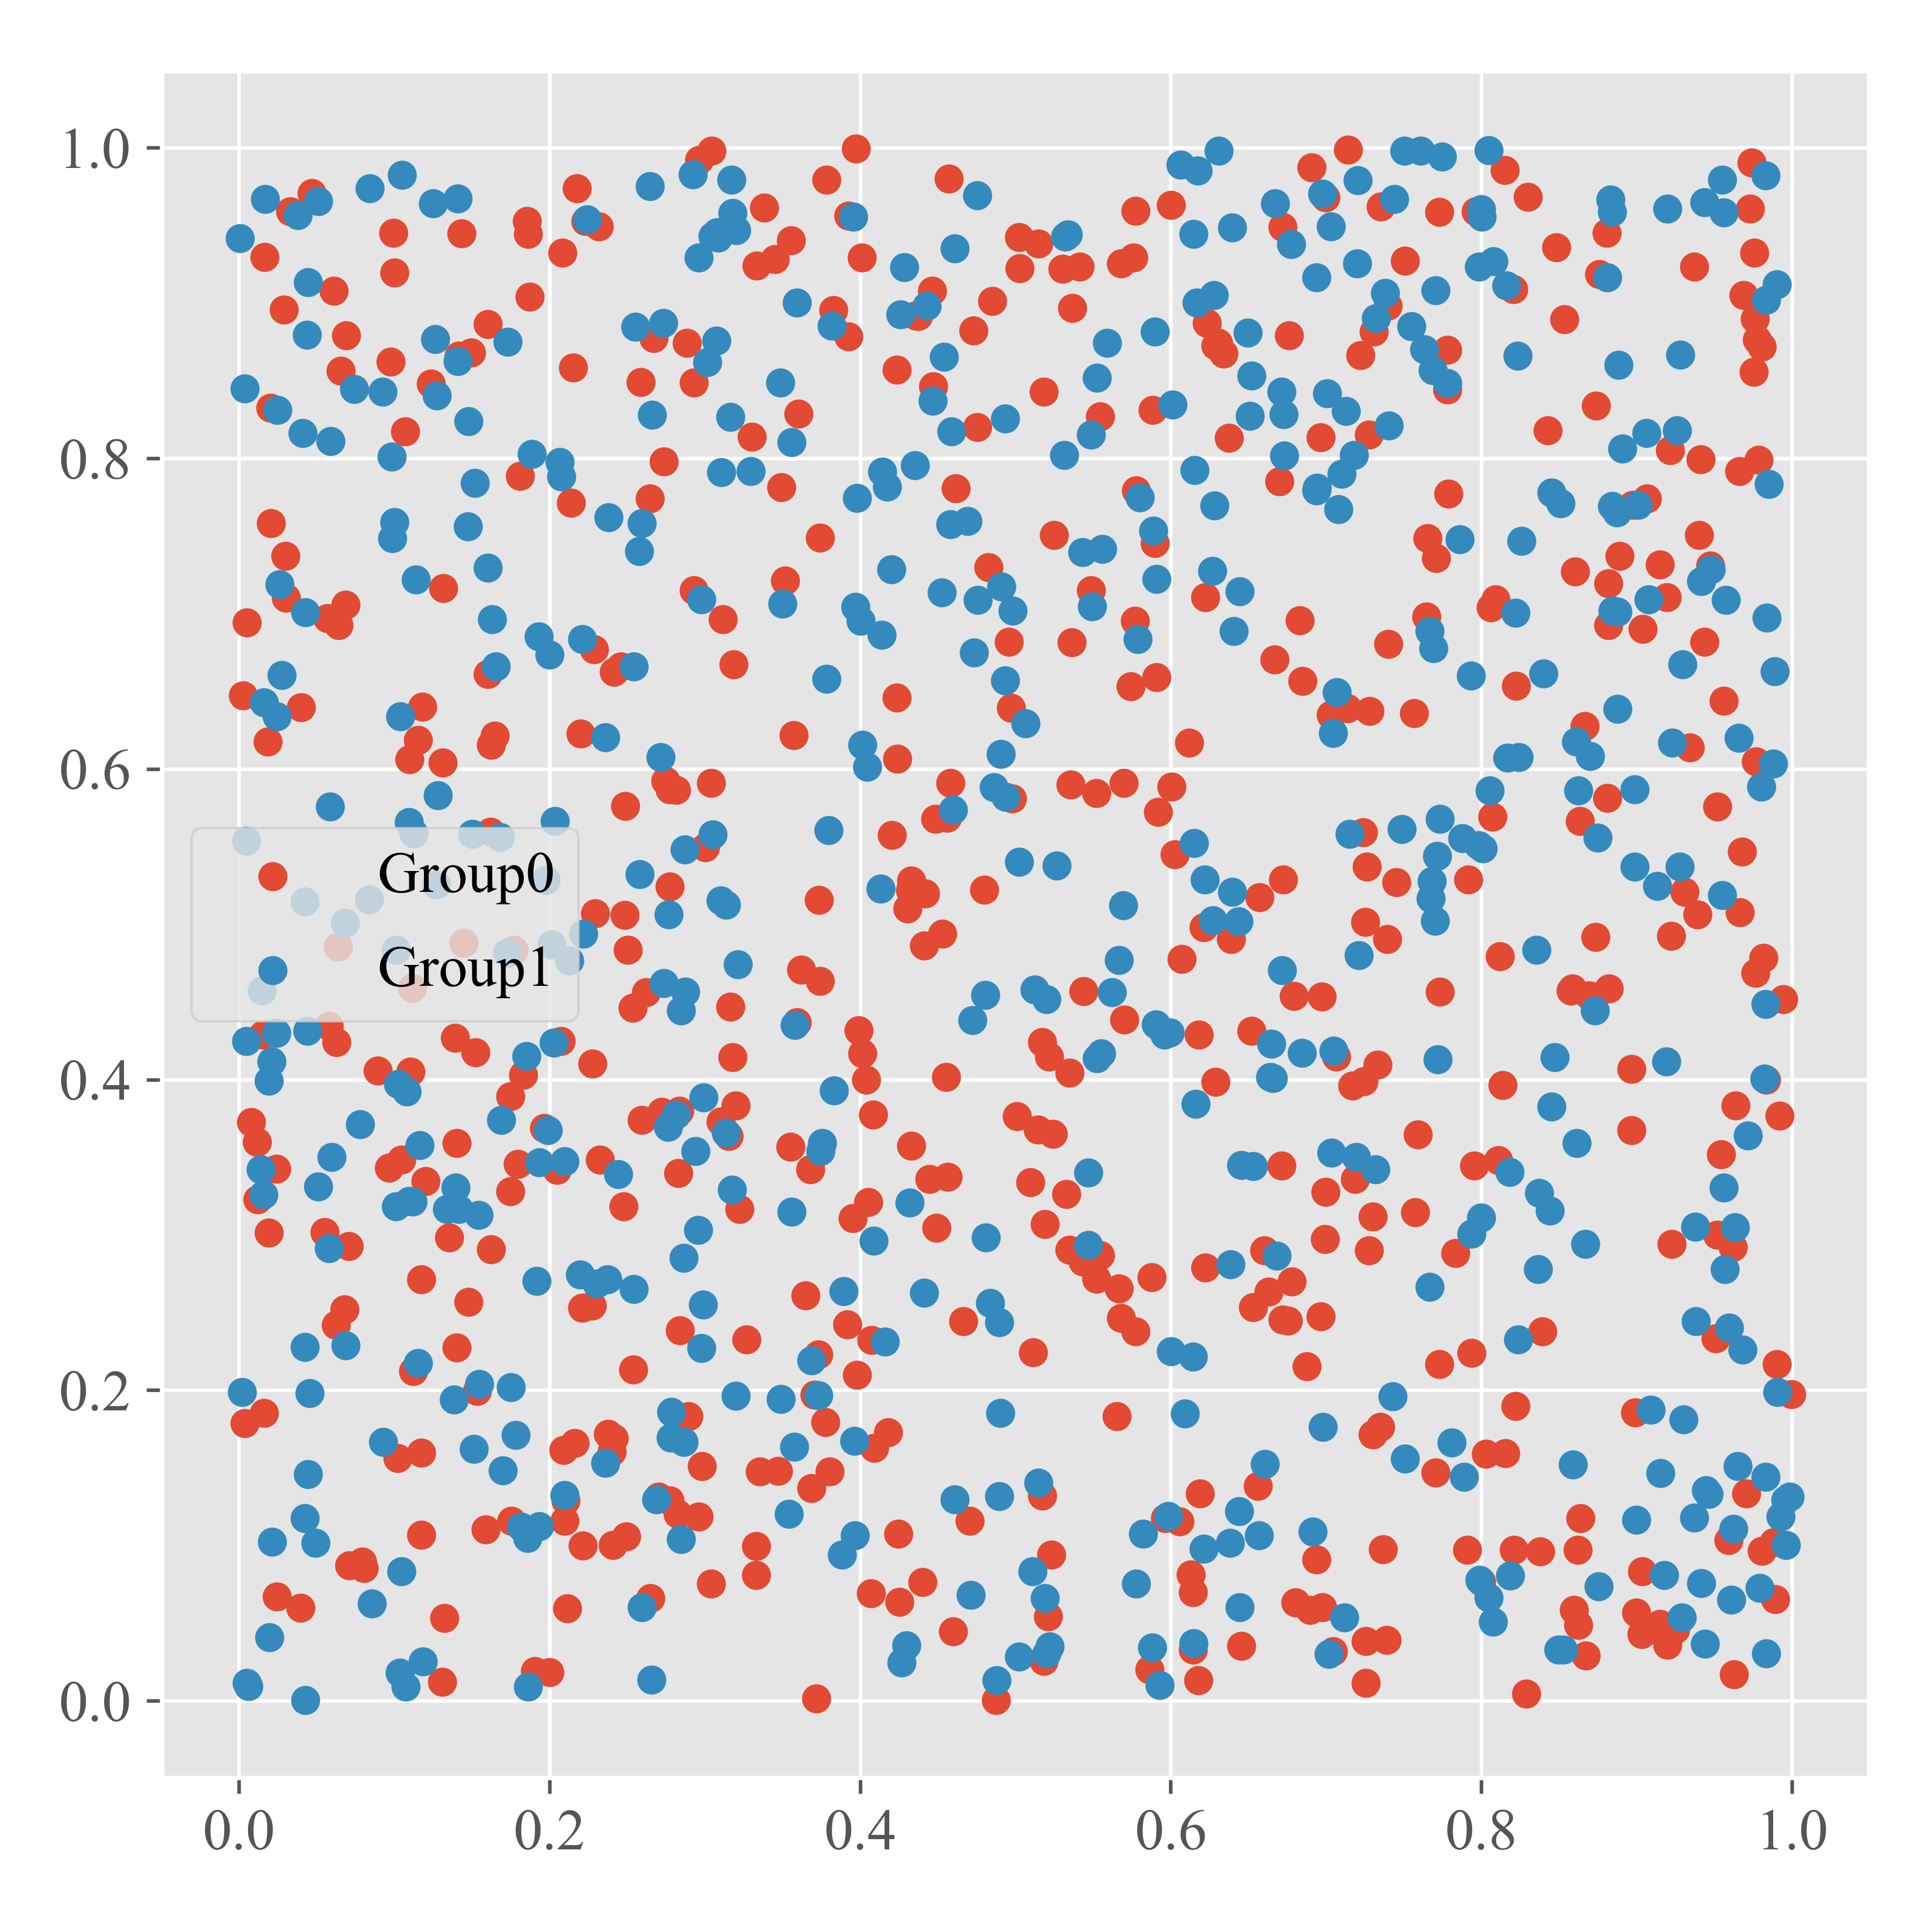
Fig. 2 After applying the function
mpl_preferences().Reset to default settings:
>>> mpl_preferences(reset=True)

>>> example_plot(random_array)
Fig. 3 Resetting the altered parameters to their default values.